Axes Redesign: Difference between revisions
From KitwarePublic
Jump to navigationJump to search
(New page: * Change the orientation of the title for the Y axis * Adjust the positions of the Y labels so that they don't overlap with the chart * Support subscripts: ** how ? ** FTGL supports [http:...) |
|||
| (3 intermediate revisions by the same user not shown) | |||
| Line 1: | Line 1: | ||
* | =Features= | ||
* Adjust the positions of the Y labels so that they don't overlap with the chart | * Choose the position of the Title and Subtitle (VTop,VMiddle,VBottom, HRight, HLeft, HMiddle) | ||
<pre> | |||
-------------------------------------------------------------------- | |||
|vtop/hleft vtop/hmiddle vtop/hright| | |||
| | | |||
| ^ | | |||
| | | | |||
| | | | |||
| | | | |||
| | | | |||
||vmiddle/hleft y| vmiddle/hmiddle vmiddle/hright| | |||
| | | | |||
| | | | |||
| | | | |||
| 0----------------------> | | |||
| x | | |||
| | | |||
||vbottom/hleft vbottom/hmiddle vbottom/hright| | |||
-------------------------------------------------------------------- | |||
</pre> | |||
* Give more control on the axis titles: | |||
** Position: inside/outside | |||
<pre> | |||
^ | |||
| | |||
Y(outside) | Y(inside) | |||
| | |||
| X(inside) | |||
o-----------------> | |||
X(outside) | |||
</pre> | |||
** Position min/middle/max | |||
<pre> | |||
Y(max) ^ | |||
| | |||
| | |||
| | |||
Y(middle) | | |||
| | |||
| | |||
Y(min) o-------------------------------> | |||
X(min) X(middle) X(max) | |||
</pre> | |||
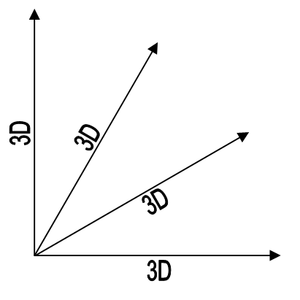
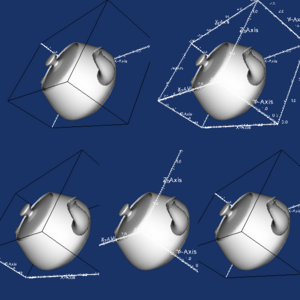
** Rotation: horizontal/vertical/[http://gnuplot.sourceforge.net/demo_4.2/histograms.1.png oblique]/auto/3D | |||
{| | |||
|[[Image:ParaView-Axes_Redesign-Auto.png|thumb|Auto: text orientation = |axis angle| > threshold ? Vertical : Horizontal]] | |||
|[[Image:ParaView-Axes_Redesign-3D.png|thumb|3D: text orientation = axis orientation]] | |||
|} | |||
** Label font size: | |||
*** Fixed (in px) | |||
*** Relative to Viewport (see [http://www.vtk.org/doc/nightly/html/classvtkTextActor.html#c4eea2af311831bbda961247684ff410 vtkTextActor]) | |||
*** Relative to Axes | |||
** ?Spacing between label and axes? | |||
*** Adjust the positions of the Y labels so that they don't overlap with the chart | |||
** Style:italic/bold/shadow/color/?antialiasing?... | |||
* Feature: Add a grid [http://www.paraview.org/Bug/view.php?id=9007 9007] | |||
* Feature: Add more axis ticks [http://www.paraview.org/Bug/view.php?id=9007 9007] | |||
* Support subscripts: | * Support subscripts: | ||
** how ? | ** how ? | ||
** FTGL supports [http://ftgl.sourceforge.net/docs/html/ftgl-tutorial.html#charmap Unicode] | *** ?Qt overlay? | ||
* Bug fixes on the existing axes actor: (list | ** FTGL currently supports [http://ftgl.sourceforge.net/docs/html/ftgl-tutorial.html#charmap Unicode] fonts | ||
=Current bugs= | |||
* Bug fixes on the existing axes actor: (list the current bugs here) | |||
** [http://www.paraview.org/Bug/view.php?id=8689 8689] | ** [http://www.paraview.org/Bug/view.php?id=8689 8689] | ||
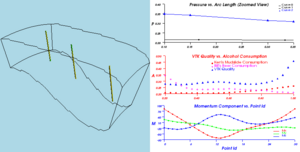
* | =Current existing actors= | ||
* | {| | ||
* | |[[Image:CubeAxes2.png|thumb|left|300px|vtkCubeAxesActor,vtkCubeAxesActor2D:CubeAxes2.png]] | ||
* | |[[Image:XyPlot2.png|thumb|left|300px|vtkXYPlotActor:xyPlot2.png]] | ||
* | |[[Image:TestLegendScaleActor.png|thumb|left|300px|vtkLegendScaleActor:TestLegendScaleActor.png]] | ||
|} | |||
=Some other applications= | |||
*Matlab | |||
{| | |||
|http://mathcs.holycross.edu/~spl/MATLAB/19.gif | |||
|http://petervieth.com/uploads/images/cabinet/graph.jpg | |||
|http://www.aquaphoenix.com/lecture/matlab7/images-large/assignment_terrain_graph2.jpg | |||
|} | |||
* TecPlot: http://www.tecplot.com/showcase/gallery/index.aspx | |||
{| | |||
| http://www.tecplot.com/images/showcase/contours/issue_28/xy_d.gif | |||
| http://www.tecplot.com/images/showcase/gallery/polar/tecplot_polar_flower.gif | |||
|} | |||
*Gnuplot: http://gnuplot.sourceforge.net/demo/ | |||
** [http://gnuplot.sourceforge.net/demo_4.3/tics.html ticmarks] | |||
** [http://gnuplot.sourceforge.net/demo_4.3/surface1.html 3D axis] | |||
* | |||
Latest revision as of 22:15, 14 July 2009
Features
- Choose the position of the Title and Subtitle (VTop,VMiddle,VBottom, HRight, HLeft, HMiddle)
--------------------------------------------------------------------
|vtop/hleft                 vtop/hmiddle                vtop/hright|
|                                                                  |
|                    ^                                             |
|                    |                                             |
|                    |                                             |
|                    |                                             |
|                    |                                             |
||vmiddle/hleft     y|    vmiddle/hmiddle            vmiddle/hright|
|                    |                                             |
|                    |                                             |
|                    |                                             |
|                    0---------------------->                      |
|                                x                                 |
|                                                                  |
||vbottom/hleft          vbottom/hmiddle             vbottom/hright|
--------------------------------------------------------------------
- Give more control on the axis titles:
- Position: inside/outside
           ^
           |
Y(outside) | Y(inside)
           |
           |     X(inside)
           o----------------->
                 X(outside)
- Position min/middle/max
       Y(max)   ^
                |
                |
                |
      Y(middle) |
                |
                |
       Y(min)   o------------------------------->
                X(min)     X(middle)           X(max)
- Rotation: horizontal/vertical/oblique/auto/3D
- Label font size:
- Fixed (in px)
- Relative to Viewport (see vtkTextActor)
- Relative to Axes
- ?Spacing between label and axes?
- Adjust the positions of the Y labels so that they don't overlap with the chart
- Style:italic/bold/shadow/color/?antialiasing?...
- Label font size:
- Feature: Add a grid 9007
- Feature: Add more axis ticks 9007
- Support subscripts:
- how ?
- ?Qt overlay?
- FTGL currently supports Unicode fonts
- how ?
Current bugs
- Bug fixes on the existing axes actor: (list the current bugs here)
Current existing actors
Some other applications
- Matlab

|

|

|

|

|


