ParaView In Action
This page captures blurbs about real-world usage of ParaView. The purpose is to compile a list of success stories with engaging images that can be used in things like web pages, posters, and elevator speeches.
UV-CDAT - Ultrascale Visualization
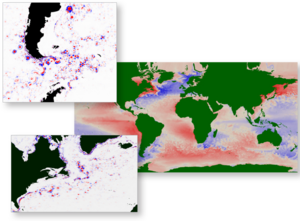
The Climate Data Analysis Tools project is using ParaView in conjunction with other open-source tools to create a robust application for analyzing and visualizing climate data. These tools will enable analysts to track, monitor and predict climate changes and develop solutions to climate challenges.
Idaho National Lab’s CAVE
ParaView is being used on Idaho National Laboratory’s Computer-Assisted Virtual Environment (CAVE) to intuitively visualize data in 3D. A CAVE enables researchers to be immersed in a 3D environment surrounded by their data, facilitating data interpretation in ways that traditional computers cannot provide.
Computational Model Building
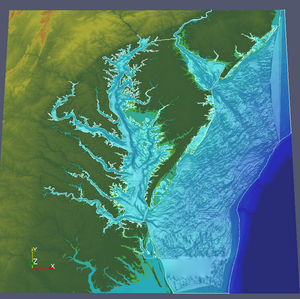
In addition to the end user application, ParaView also provides a set of libraries, which enables developers to use ParaView’s client/server architecture in creating their own applications. One example is the Computational Model Builder Suite which is being developed for the U.S. Army Engineer Research and Development Center (ERDC). The CMB Suite addresses the pre and post processing needs associated with groundwater and surface water hydrological simulations. The CMB Suite includes the following applications:
- Points Builder – a tool for manipulating scatter point data
- Scene Builder – a tool for combining different solids and terrain information in order to produce the appropriate geometric shape of the domain
- Model Builder – a tool for modifying the topology of the geometric domain in order to assign appropriate boundary conditions to parts of the domain boundary.
- Sim Builder – a component inside Model Builder that manages the simulation information (material properties, boundary conditions, auxiliary geometry, etc..) and can export the information to form the appropriate format for the simulation. In the case of 2D domains, it also provides triangle meshing capabilities.
- Mesh Viewer – a tool for manipulating meshes
- Omicron – a mesher developed by ERDC
- ParaView Application – for visualizing and analyzing the simulation results.
Astrophysics
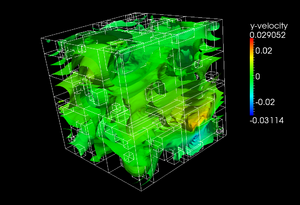
ParaView’s demand-driven architecture promotes exploratory visualization and enables astrophysicists to easily and efficiently mine their data. In this example, the time varying data is represented using AMR (Adaptive Mesh Refinement) structures and can be extremely large.The interface allows simultaneous inspection of both particle quantities and fluid data including analysis and identification of halo regions by integrating commonly employed external tools and algorithms.Typically simulations can be 10GB to up to half a terabyte, which includes all attributes and particles.
Magnetic Reconnection in Earth’s Magnetosphere
Researchers from Los Alamos National Laboratory and University of California at San Diego used ParaView to visualize the output of a simulation that was run on 196,608 cores of Jaguar at Oak Ridge National Laboratory. The goal of the project is to study the magnetic reconnection in the Earth’s magnetosphere using fully kinetic particle-in-cell simulations. Due to the size of the dataset (~200 TB), analysis and visualization presented significant challenges. However, by harnessing the power of parallel processing through ParaView, the data was successfully analyzed on Jaguar. This image shows the development of a turbulent reconnection in a large-scale electron-positron plasma using an isosurface of particle density colored by current density.
Turbulent/Non-Turbulent Interface DNS Simulations
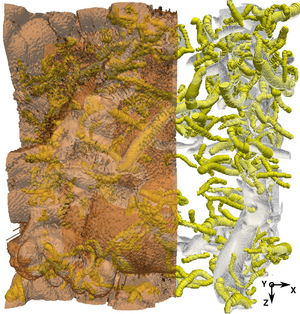
ParaView continues to gain recognition in the Computational Fluid Dynamics Community. This image, authored by Ricardo J. N. dos Reis, was chosen to illustrate the front cover of the February 2011 Philosophical Transactions A of the Royal Society themed issue “Dynamical Barriers and Interfaces in Turbulent Flows.” It represents a temporal plane jet DNS simulation, where, orange denotes the interface between the turbulent and non-turbulent flow. Yellow represents the radius of identified Intense Vorticity Structures and the white mesh contours use a pressure value for identifying some Large Scale Vortex structures.
In-Situ Analysis of Air Flow on Supercomputers
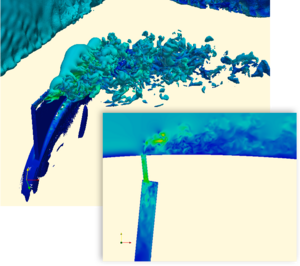
ParaView’s coprocessing tools are coupled with PHASTA, a massively parallel CFD code developed by Ken Jansen from the University of Colorado, to simulate a synthetic jet’s impact on flow over an aircraft wing. Results were obtained while the simulation code was running, which enables designers to get immediate feedback and adjust flow control parameters of the jet (e.g. frequency and amplitude of the jet). By running on many cores, in this case over 160,000, and getting immediate feedback from ParaView’s co-processing library, an analyst spends more time improving the design and less time waiting for the results to be examined.
Chemistry
Chemistry and in silico studies are playing an increasingly significant role in many areas of research. Kitware is creating the state-of-the-art computational workbench, making the premier computational chemistry codes and databases easily accessible to chemistry practitioners. We are developing an open, extensible application framework that puts computational tools, data and domain specific knowledge at the fingertips of chemists. We are extending the work already done in Avogadro, and developing new applications and libraries to augment existing functionality.
Verification of ALEGRA Simulations
Computer simulation is a key component in modern scientific analysis. Simulations provide more control over variables and more detail in their outputs than their experimental counterparts while allowing for more runs at a fraction of the price. However, simulation results are worthless without verification, which ensures that a simulation can reliably compute the results of a simulation with a known analytical solution.
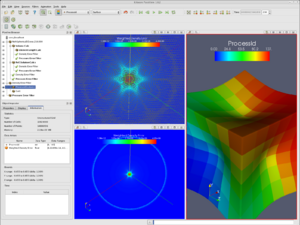
Verification becomes more difficult with the growth of size and complexity in the simulations. Analysts at Sandia National Laboratories are leveraging the python scripting, scalable parallel processing, and multiview technologies of ParaView to simplify the verification of ALEGRA simulations for High Energy Density Physics (HEDP). The embedded python interpreter allows users to easily build custom parallel computations for analytical solutions, volume integrals, and error metrics over large meshes. Client side scripting also facilitates automated post-processing verification and ParaView’s multiview capability facilitates comparison of results. The visualization shown here displays the computed error metrics for a 13 million-cell unstructured data set.
Distance Visualization for Terascale Data
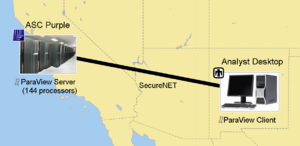
Visualizing the worlds largest simulations introduces a multitude of pragmatic issues. Moving such large quantities of data is infeasible. The simulation hardware is often unique, complex, and built without visualization or post processing in mind. Furthermore, the hardware resources may be located far away and without the high speed connections expected in a local network. Such was the case for a set of analysts and Sandia National Laboratory studying high energy density physics (HEDP). HEDP simulations ran on the ASC Purple supercomputer located in Lawrence Livermore National Laboratory, over 850 miles (1300 km) from the analysts' office. Any communication between these two sites required the use of SecureNET, an encrypted communication channel with moderate communication speeds (45-600 Mbps). ParaView provides the remote analysis capability our scientists need. ParaView is deployed on ASC Purple "out-of-the-box" despite the complexity of hardware, and ParaView's quality parallel rendering and image delivery mechanism make remotely interacting with the data simple and effective.
Golevka Asteroid
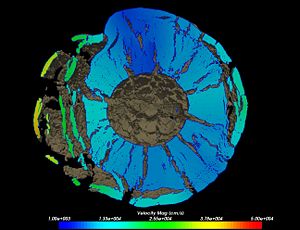
In this CTH shock physics simulation, a 10 megaton explosion is detonated at the center of the Golevka asteroid, which has an approximate volume of 210 million cubic meters (500m x 600m x 700m). The mesh the simulation uses has a 1 meter resolution consistent over the 1 cubic kilometer mesh, resulting in over 1 billion cells. The remarkable resolution of this simulation provides realism in crack propagation not seen in lower-resolution models. The simulation was run for 15 hours on 7200 nodes of Sandia National Laboratories' Red Storm supercomputer.
The visualization, here showing a cut through the center of the asteroid with velocity magnitude colored on the cut surface, is enabled via ParaView's scalable visualization code running in parallel on 128 visualization nodes.
Polar Vortex Breakdown
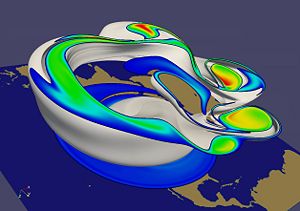
This terabyte SEAM Climate Modeling simulation models the breakdown of the polar vortex, a circumpolar jet that traps polar air at high latitudes, creating conditions favorable for ozone depletion. The breakdown of the vortex, which occurs once or twice a year in the polar wintertime stratosphere, can transport ozone-depleting polar air well into the mid latitudes. The 1 billion cell structured mesh reveals fine details of the weather pattern not represented in previous simulations.
The visualization is enabled via ParaView's scalable visualization and rendering code running on over 128 visualization nodes delivered to the analyst's desktop computer at interactive rates.
Cross Wind Fire
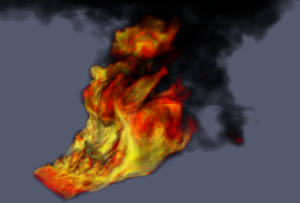
This 150 million degree-of-freedom, loosely coupled SIERRA/Fuego/Syrinx/Calore simulation models objects-in-crosswind fire. It features three regions: one fluids and participating media radiation region and two conducting regions. The simulation was run on 5000 nodes of Sandia National Laboratories' Red Storm supercomputer and is part of a qualification test plan for system testing to be conducted at the new Thermal Test Complex Cross Wind Facility.
The visualization, showing the temperature of the gasses, showcases the unique parallel unstructured volume rendering capabilities feature of ParaView contributed by Sandia National Laboratories.
Parallel Rendering
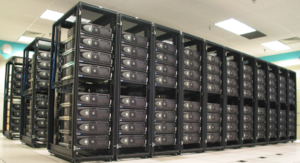
Sandia National Laboratories, in conjunction with NVIDIA Corporation and Kitware, Inc., have established ParaView as the world leader in parallel rendering performance. In a November 2005 press release, Sandia demonstrated ParaView delivering over 8 billion polygons per second rendered on the Red RoSE visualization cluster and delivered to an analyst's desktop. ParaView's record breaking rendering speeds are made possible with Sandia's parallel rendering library (IceT) and Sandia's image compression system (SQUIRT).
3D Rayleigh-Benard convection problem
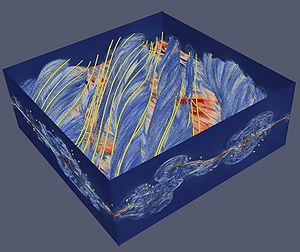
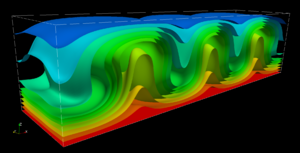
This problem was used to investigate EdgeCFD's code performance in a large scale simulation. EdgeCFD is an implicit edge-based coupled fluid flow and transport solver for solving large scale problems in modern clusters, supporting stabilized and variational multiscale finite element formulations IJNMF2007. The benchmark corresponds to a rectangular 3D domain of aspect ratio 4:1:1 aligned with the Cartesian axes and subjected to a temperature gradient. The simulation was made on a 501×125×125 mesh, resulting in 39,140,625 tetrahedral elements. The figure shows the convective rolls obtained at Rayleigh number Ra=30,000 and Prandt number Pr=0.71. This solution was obtained on 128 cores of a SGI Altix ICE 8200 cluster installed at High Performance Computing Center NACAD of Federal University of Rio de Janeiro UFRJ. Every time step employed an Inexact Newton method and two nonlinear systems of equations, for flow and temperature, respectively with 31M and 7.8M equations. Time step solutions were stored using the Xdmf file format in a temporal collection of geometry collections scheme, summarizing 1936 files for 15/2955 (stored/total). The simulation took about 170 hours (1 week approximately) and the post-processing was done using ParaView in a remote-client x server offscreen rendering scheme.
Acknowledgements
Sandia is a multiprogram laboratory operated by Sandia Corporation, a Lockheed Martin Company, for the United States Department of Energy's National Nuclear Security Administration under contract DE-AC04-94AL85000.
