ParaView/Memory Inspector Panel: Difference between revisions
From KitwarePublic
< ParaView
Jump to navigationJump to search
No edit summary |
No edit summary |
||
| Line 1: | Line 1: | ||
== User Interface and Layout == | == User Interface and Layout == | ||
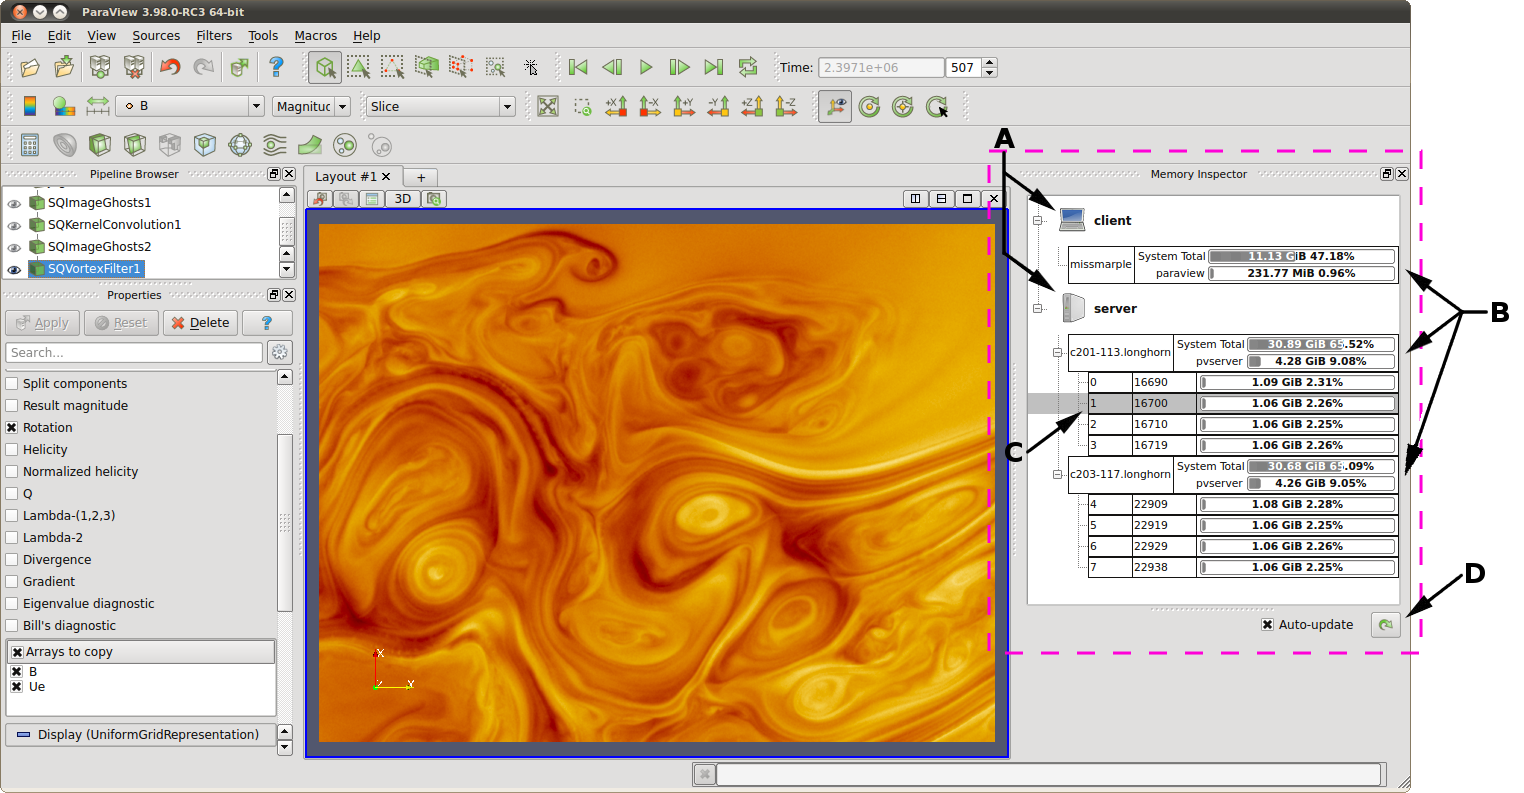
[[File:Meminsp-pv-gui.png]] | [[File:Meminsp-pv-gui.png|width896|frame|border|Figure 1: The memory inspector panel shown in action. See text for details.]] | ||
Figure 1 shows the main UI features of the Memory Inspector Panel. | |||
<ol style="list-style-type: upper-alpha;"> | |||
<li> Process Groups </li> | |||
<li> Host total usage all processes </li> | |||
<li> ParaView cumulative host usage </li> | |||
<li> ParaView individual rank usage </li> | |||
<li> Update controls </li> | |||
</ol> | |||
The memory inspector panel displays information about the current memory usage on the client and server hosts. The panel is organized by groups, depending on the connection type. There are a few classes of groups: | |||
; Client : There is alway a client group which reports statistics about the ParaView client | |||
; Sever : When running in client server mode a server group reports statistics about the hosts where pvserevr processes are running. | |||
=== Groups === | === Groups === | ||
=== Hosts === | === Hosts === | ||
=== Ranks === | === Ranks === | ||
=== Context Menus === | === Context Menus === | ||
<br clear=all> | |||
== Debugging Features == | == Debugging Features == | ||
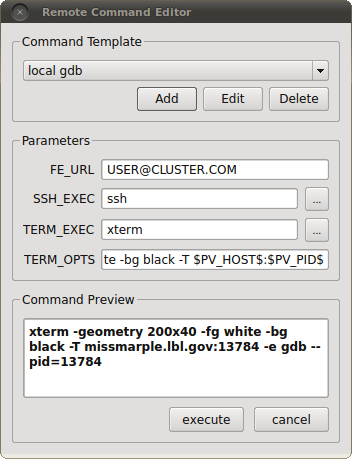
=== Remote Commands === | === Remote Commands === | ||
File:Meminsp-remote-command.png | [[File:Meminsp-remote-command.png]] | ||
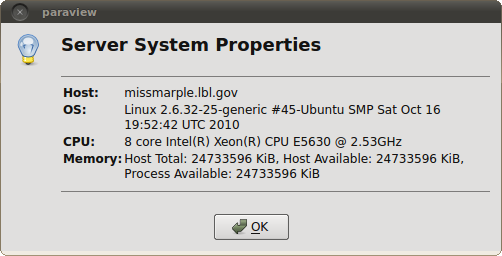
=== Host Properties === | === Host Properties === | ||
[[File:Meminsp-host-props.png]] | [[File:Meminsp-host-props.png]] | ||
=== Stack Trace Signal Handler === | === Stack Trace Signal Handler === | ||
<br clear=all> | |||
== SMP Considerations == | |||
Revision as of 21:05, 30 November 2012
User Interface and Layout
Figure 1 shows the main UI features of the Memory Inspector Panel.
- Process Groups
- Host total usage all processes
- ParaView cumulative host usage
- ParaView individual rank usage
- Update controls
The memory inspector panel displays information about the current memory usage on the client and server hosts. The panel is organized by groups, depending on the connection type. There are a few classes of groups:
- Client
- There is alway a client group which reports statistics about the ParaView client
- Sever
- When running in client server mode a server group reports statistics about the hosts where pvserevr processes are running.
Groups
Hosts
Ranks
Context Menus
Debugging Features
Remote Commands
Host Properties
Stack Trace Signal Handler


