ParaView/Users Guide/Memory Inspector: Difference between revisions
| Line 7: | Line 7: | ||
[[File:MemoryInspector.png|thumb|center|400px|link=|'''Figure:''' Memory Inspector Panel]] | [[File:MemoryInspector.png|thumb|center|400px|link=|'''Figure:''' Memory Inspector Panel]] | ||
For performance reasons, the information | For performance reasons, the information can be updated upon user request but also for convenience this can be done automatically by selecting the checkbox. | ||
On the client you can get more information by asking to show the properties (Right click on the Client icon). | |||
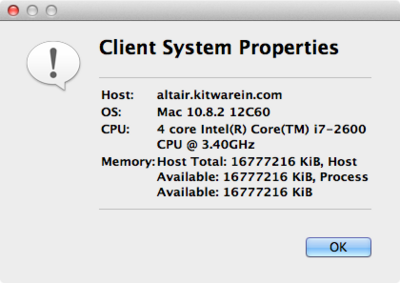
[[File:PV_MemoryInspectorProperties.png|thumb|center|400px|link=|'''Figure:''' Memory Inspector Property Panel]] | |||
Revision as of 20:39, 7 November 2012
Memory Inspector
As explained earlier, both the Information panel, and the Statistics inspector are prone to over and under estimate the total memory used for the current pipeline. The Memory Inspector, provides a mechanism to request the Operating System for the total memory used on the system.
The inspector can be accessed from the View menu. It provides assorted information including the physical (or virtual) memory used, physical (or virtual) memory available, and total physical (or virtual) memory present on each of the nodes hosting the process. Note that this is not process specific information, but information for the node hosting the process.
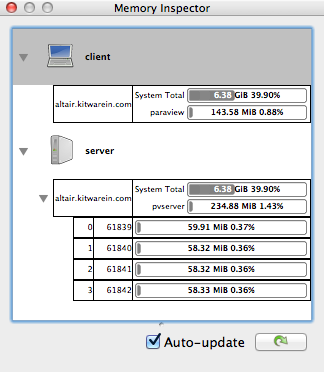
For performance reasons, the information can be updated upon user request but also for convenience this can be done automatically by selecting the checkbox.
On the client you can get more information by asking to show the properties (Right click on the Client icon).