Proposals:Refactoring Statistics Framework 2007 Class Manifesto
From KitwarePublic
Statistics Class Manifesto
Summary Table
They are categorized in the following table
| Conceptual Class | Number |
|---|---|
| Measurement Containers | 8 |
| Frequency Containers | 2 |
| Process Objects | 2 |
| Traits | 1 |
| Mean shift | 3 |
| Adaptors | 5 |
| Univariate Distributions | 4 |
| Algorithms | 3 |
| Calculators | 6 |
| Generators | 12 |
| Filters | 10 |
| Multivariate Density Functions | 8 |
| Distance Metrics | 2 |
| Components | 4 |
| Estimators | 2 |
| Total | 72 |
List of Classes per Category
Measurement Containers
- KdTree
- Histogram
- VariableDimensionHistogram
- ListSampleBase
- ListSample
- Sample
- Subsample
- MembershipSample
Frequency Containers
- DenseFrequencyContainer
- SparseFrequencyContainer
Process Objects
- SampleClassifier
- SampleClassifierWithMask
Traits
- MeasurementVectorTraits
MeanShift
- HypersphereKernelMeanShiftModeSeeker
- MeanShiftModeCacheMethod
- MeanShiftModeSeekerBase
Adaptors
- ImageToCooccurrenceListAdaptor
- ImageToListAdaptor
- JointDomainImageToListAdaptor
- PointSetToListAdaptor
- ScalarImageToListAdaptor
Univariate Distributions
- ChiSquareDistribution
- GaussianDistribution
- ProbabilityDistribution
- TDistribution
Algorithms
- SampleAlgorithmBase
- StatisticsAlgorithm
- NeighborhoodSampler
Calculators
- CovarianceCalculator
- GreyLevelCooccurrenceMatrixTextureCoefficientsCalculator
- MeanCalculator
- ScalarImageTextureCalculator
- WeightedCovarianceCalculator
- WeightedMeanCalculator
Generators
- ImageToHistogramGenerator
- ImageToListGenerator
- KdTreeGenerator
- ListSampleToHistogramGenerator
- MaskedScalarImageToGreyLevelCooccurrenceMatrixGenerator
- MembershipSampleGenerator
- NormalVariateGenerator
- RandomVariateGeneratorBase
- ScalarImageToGreyLevelCooccurrenceMatrixGenerator
- ScalarImageToHistogramGenerator
- SelectiveSubsampleGenerator
- WeightedCentroidKdTreeGenerator
Filters
- HistogramToEntropyImageFilter
- HistogramToImageFilter
- HistogramToIntensityImageFilter
- HistogramToLogProbabilityImageFilter
- HistogramToProbabilityImageFilter
- ListSampleToHistogramFilter
- SampleMeanShiftBlurringFilter
- SampleMeanShiftClusteringFilter
- SampleSelectiveMeanShiftBlurringFilter
- SampleToHistogramProjectionFilter
Multivariate Density Functions
- DensityFunction
- DistanceToCentroidMembershipFunction
- GaussianDensityFunction
- GoodnessOfFitFunctionBase
- GoodnessOfFitMixtureModelCostFunction
- LogLikelihoodGoodnessOfFitFunction
- MahalanobisDistanceMembershipFunction
- MembershipFunctionBase
Distance Metrics
- DistanceMetric
- EuclideanDistance
Components
- GaussianGoodnessOfFitComponent
- GaussianMixtureModelComponent
- GoodnessOfFitComponentBase
- MixtureModelComponentBase
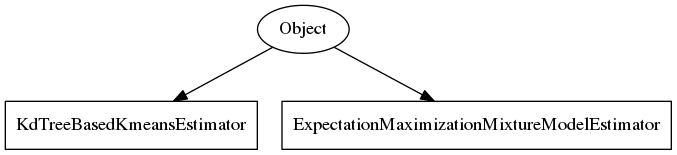
Estimators
- ExpectationMaximizationMixtureModelEstimator
- KdTreeBasedKmeansEstimator
Class Diagrams
Measurement Containers
Frequency Containers
Process Objects
Traits
MeanShift
Adaptors
Univariate Distributions
Algorithms
Calculators
Generators
Filters
Multivariate Density Functions
Distance Metrics