VTK/Charts/ChartAPI
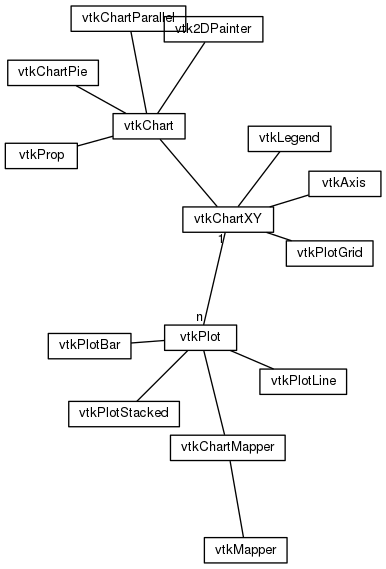
The diagram below shows the basic relationship between the different classes that make up a chart. For clarity only the composition of a vtkChartXY is shown, but all charts have multiple components used to draw their parts. Each component class that has something rendered to the screen has a function with the following prototype,
<source lang="cpp">bool Paint(vtk2DPainter *painter);</source>
These member functions are called by the chart's RenderOverlay function. The chart manages the order in which the Paint functions are called, and so the grid would be drawn over by the plots, and they in turn would be drawn over by the axes and text.
Rendering Philosophy
The base class makes no assumptions about the rendering philosophy employed by any particular chart. In the vtkChartXY I have taken a two pass approach. The data plots are drawn using a view transform according to the extents of the plot set by the vtkAxis objects in x and y. So they can be cached in an OpenGL display list and replayed as the chart changes the range of x and y that are plotted. The plot area is also clipped so that anything outside of the plot area is discarded.
The second pass is rendered in device coordinates for the axes, legend etc. Thanks to the way that OpenGL handles line thickness and point size they are not scaled by the model view matrix. Other backends may need to perform the matrix multiplies on the CPU, but this allows the OpenGL backend to take advantage of hardware acceleration.