Volume rendering - Fire
Introduction
Fire is visualized using ParaView's volume rendering functionality. Unfortunately fire simulations are extremely large. Fortunately, we can use disk_out_ref.exo as a substitute dataset.
Note: Volume rendering is very resource intensive. It is possible to display a dataset using surface that chokes using Volume Rendering. The solution is to grab more nodes of your cluster (thus picking up more memory).
Note: Currently (3.6.2 and 3.8.0), volume rendering only works on one block at a time. Thus, before volume rendering multiple blocks, run the "Merge Block" filter. This should be fixed in a future version of ParaView.
Note: Hitting the <CR> key will close this window, which is not expected behavior.
- Start ParaView
- Open disk_out_ref.exo. Select all variables. Apply.
- Color by temperature.
- Representation by Volume Rendering.
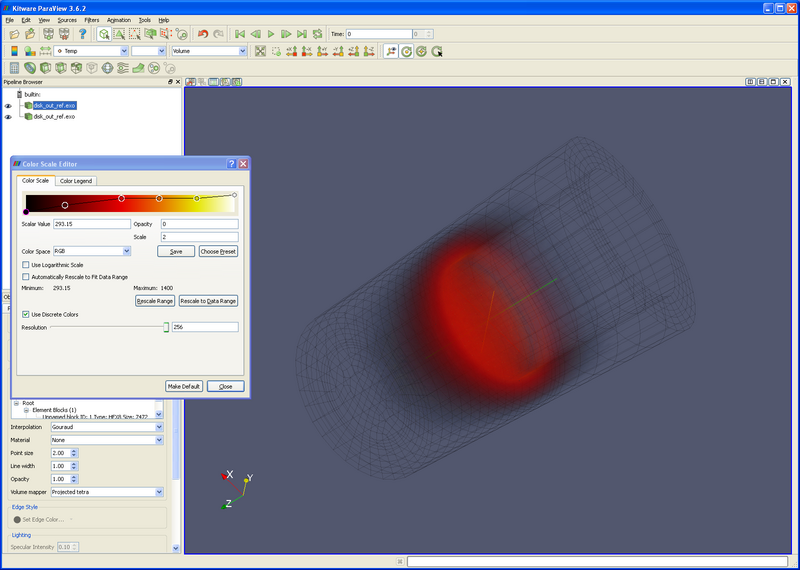
Since this tutorial is for rendering fire, we need to make disk_out_ref.exo look like fire.
- Edit Color Map
- Choose Preset. Choose Black-Body Radiation. OK.
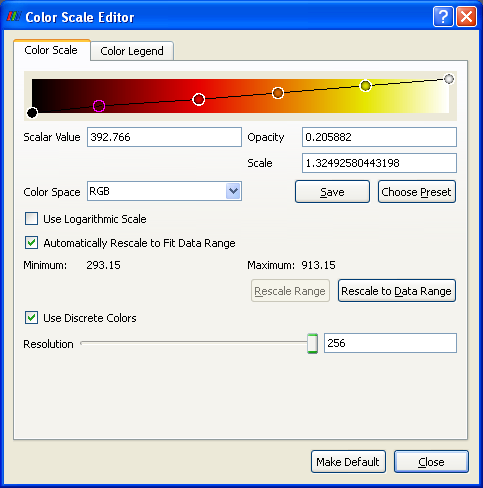
- Add a point on the color scale in the orange area, and another at the top of the black. See the Color Scale Editor below.
- You can create a point on the color scale by clicking in the window.
- You can select a point on the color scale by clicking on it.
- You can move between points using the Tab and <SHFT>-Tab keys.
- You can delete points using the delete key.
We now need to set the temperature, opacity and scale.
- The temperature should be set by the physical laws of a black body curve. Thus, set the 6 points as follows, starting from the left:
- Point 0 - Cold air - Scalar Value = 300
- Point 1 - Soot - Scalar Value = 500
- Point 2 - Red glow - Scalar Value = 800
- Point 3 - Orange glow - Scalar Value = 1000
- Point 4 - Yellow hot - Scalar Value = 1200
- Point 5 - White hot - Scalar Value = 1500
- The Opacity requires a bit of artistic license. What we are trying to do is show the different temperatures inside of the flame. Also, we may want to show differing amounts of soot - which will be point number1. Thus, a user needs to play with these capacities to get desired results. Starting from the left:
- Point 0 - Cold air - Opacity = 0 - This represents cool air that does not have a color.
- Point 1 - Soot - Opacity = 0.2-0.5 - This represents soot.
- Point 2 - Red glow - Opacity = 0.4-1.0 - This represents the air as it is starting to glow.
- Point 3 - Orange glow - Opacity = 0.6-1.0 - The air is getting hotter again.
- Point 4 - Yellow hot - Opacity = 0.8-1.0 - Yellow hot.
- Point 5 - White hot - Opacity = 1.0 - White. We want this to be totally opaque.
Last, the user will want to play with the Scale. This will change between datasets. Start with 5, and move up and/or down.
Acknowledgements
Sandia National Laboratories is a multi-mission laboratory managed and operated by National Technology and Engineering Solutions of Sandia, LLC., a wholly owned subsidiary of Honeywell International, Inc., for the U.S. Department of Energy’s National Nuclear Security Administration under contract DE-NA-0003525.

