Data Selection
Introduction
One of the major design goals of ParaView 3 is to add support for quantitative analysis. In addition to better charting, Python-based filtering and statistical analysis tools, we have been working on the capability of focusing the analysis on a specific subset of a dataset. This can be achieved using the selection mechanism described in this article.
Selection is the mechanism for identifying a subset of a dataset by using user specified criteria. This subset can be a set of point or cells or a block of composite dataset. This functionality allows users to focus on a smaller subset that is important. For example, the elements of a finite-element mesh that have pressure above a certain threshold can be identified very easily using the threshold selection. Furthermore, this selection can be converted to a set of global element ids in order to plot the attribute values of those elements over time.
ParaView supports a single active selection. This selection is associated with a data source (here data source refers to any reader, source or filter) and is shown in every view that displays the data source’s output. This article uses a use-case driven approach to demonstrate how this selection can be described and used. In the next section, we introduce the main GUI components that are used in the article. The subsequent sections address different use cases.
Please note that many features discussed in this article are recent additions and are not available in 3.2. You may want to download a development snapshot or build your own binary from the CVS source base. Otherwise, you will have to wait until 3.4 is out.
Selection Inspector
ParaView provides a selection inspector (referred to simply as the inspector in this article) to inspect and edit the details about the active selection. One can toggle the inspector visibility from the View menu. The inspector can be used to create a new active selection, view/edit the properties of the active selection as well as change the way the selection is displayed in the 3D window e.g. change the color, show labels etc.
We will look at each of these options as we try to explore the different selection types in ParaView.
Spreadsheet View
Spreadsheet View provides data exploration capabilities. One of the common complaints many users have is not being able to look at the raw data directly. Spreadsheet view provides exactly that. It allows the user to look at the raw cell data, point data or field data associated with a dataset.
ParaView treats spreadsheet view exactly like the other views such as the 3D view, Bar Chart view etc. To create the spreadsheet view, first split the workspace and then choose Spreadsheet View from the options listed. At this time if any source is currently selected in the Pipeline Browser, the spreadsheet view will automatically shows its point data. We can choose the source whose output we want to view using the eyeball in the Pipeline Browser, which is equivalent to turning on the visibility of the source in this view. Spreadsheet view can only show one dataset at a time.
When the spreadsheet view is active (i.e. selected by clicking on its toolbar), and the visible source is selected in the pipeline browser, the Display tab in the Object Inspector panel can be used to control what is shown in this view. This panel contains a selector that can be used to toggle between point and cell data. For composite datasets (multi-block and AMR datasets), it shows a Composite Data Structure tree that can be used to select the block that is shown in the view. Another widget named Show only selected elements can be selected to restrict what is shown in the spreadsheet to only selected cells or points. We will revisit this check box later.
Create a Selection
In this section we will discuss different ways of creating a selection.
Select cells/points on the Surface
One of the simplest use-cases is to select cells or points on the surface of the dataset. It is possible to select surface cells by drawing a rubber-band on the 3D view. With the 3D view showing the dataset active, click on Select Cells (or Points) On in the Selection Controls toolbar or under the Edit menu (you can also use the ‘S’ key a shortcut for ‘Select Cells On’). This will put ParaView into a selection mode. In this mode, click and drag over the surface of the dataset in the active view to select the cells (or points) on the surface. If anything was selected, it will be highlighted in all the views showing the data and the source producing the selected dataset will become active in the Pipeline Browser. ParaView supports selecting only one source at a time. Hence even if you draw the rubber band such that it covers data from multiple sources, only one of them will be selected (the one that has the largest number of selected cells or points).
As mentioned earlier, when data from a source is selected, all the views displaying the data show the selection. This includes spreadsheet view as well. If the spreadsheet view will show cell or point attributes of the selected data, then it will highlight the corresponding rows. When selecting points, the spreadsheet view will show the selection only if point attributes are being displayed. When selecting cells, it will highlight the cells in the cell attribute mode, and highlight the points forming the cells in the point attribute mode. For any decent sized dataset, it can be a bit tricky to locate the selected rows. In that case, the Show only selected elements on the display tab can be used to hide all the rows that were not selected.
When selecting cells (or points) on the surface, ParaView determines the cell (or point) ids for each of the cell (or point) rendered within the selection box. The selection is simply the ids for cells (or points) thus determined.
For id-based cell (or point) selection, you can expand the current selection by keeping the 'ctrl' key ('cmd' key on mac) pressed when clicking and dragging in selection mode. ParaView will then try to expand the current selection by adding the newly selected elements to the existing one. You can also substract from the current selection using the 'shift' key, or even toggle using 'ctrl'+'shift' keys. Selection modifier buttons can be used for the same effect.
Select cells/points using a Frustum
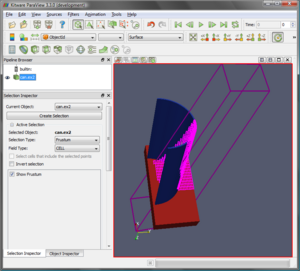
This is similar to selecting on the surface except that instead of selecting the cells (or points) on the surface of the dataset, it selects all cells (or points) that lie within the frustum formed by extruding the rectangular rubber band drawn on the view into 3D space. To perform a frustum selection, we use Select Cells (or Points) Through in the Selection Controls toolbar or under the Edit menu. As with surface selection, the selected cells/points are shown in all the views in which the data is shown including the spreadsheet view. Unlike surface selection, the indices of the cells or points are not computed after a frustum selection. Instead ParaView performs intersections to identify the cells (or points) that lie within the frustum. Note that this selection can produce a very large selection. This may be time consuming and can increase the memory usage significantly.
Select Blocks in a Composite Dataset
Composite datasets are multi-block or AMR (adaptive mesh refinement) datasets. In case of multi-block datasets, each block may represent different components of a large assembly e.g. tires, chassis etc. for a car dataset. Just like selecting cells or points, it is possible to select entire blocks. To enter the block selection mode use Select Block in the Selection Controls toolbar or under the Edit menu (you can also use the ‘B’ key as a shortcut for Select Block). Once in block selection mode, you can simply click on the block in the 3D view to select a single block or click and drag to select multiple blocks. When a block is selected, its surface cells will be highlighted.
Select using the Spreadsheet View
Until now we have been looking at defining the selection on the 3D view. Now we will see how to create selections using the spreadsheet view. As we discussed earlier, the spreadsheet view simply shows the raw cell (point or field) data in a table. Each row represents a unique cell (or point) from the dataset. Like with any other spreadsheet application, one can select a cell (or a point) by simply clicking on the row to select. One can expand the selection using Ctrl, Shift keys while clicking. If the spreadsheet view is currently showing point attributes, then selecting on it will create a point based selection. Similarly, if it’s showing cell attributes then it will create a cell based selection. Selection cannot be created when showing field attributes which are not associated with any cell or point.
We know that all views showing a selected dataset show the selection. The spreadsheet view showing the data from a source selected in the 3D view highlights the corresponding cells/points. Conversely, when we create a selection in the spreadsheet view, the corresponding cell (or point) gets highlighted in all the 3D views showing the source.
Select using the Selection Inspector
We have seen how to use the different views for creating different types of selections. However, sometimes you may want to tweak the selection or create a new selection with a known set of cell (or point) ids or create selections based of value of any array or location etc. This is possible using the selection inspector.
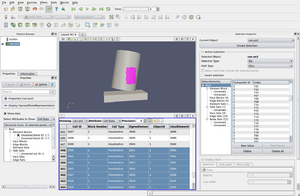
Whenever a selection is created in any of the views, it becomes the active selection. The active selection is always shown in the selection inspector. For example, if you select cells on the surface of a dataset, then as shown in Figure [1], the selection inspector will show indices for the cells selected.
The selection inspector has three sections: the topmost Current Object and Create Selection are used to choose the source whose output you want to create a selection on. The Active Selection group shows the details of the active selection, if any. The Display Style group makes it possible to change the way the selection in shown in the active 3D view.
To create a new selection, choose the source whose output needs to be selected in the Current Object combo-box and then hit Create Selection. An empty selection will be created and its properties will be shown in the active selection group. Alternatively you can use any of the methods described earlier to create a selection. It will still be shown in the selection inspector.
When you select cells (or points) on the surface or using the spreadsheet view, the selection type is set to IDs. Creating a frustum selection results in a selection with the selection type set to Frustum, while selecting a block in a composite dataset creates a Block selection. Field Type indicates whether cells or points are to be selected.
In the active selection group, Selection Type indicates the type of the active selection. One can change the type by choosing one of the available options.
As shown in Figure [1], for IDs selection, the inspector lists all the selected cell or point indices. You can edit the list of ids to add or remove values. When connected to a parallel server, cell or point ids are not unique. Hence, one has to additionally specify the process number for each cell or point id. Process number -1 implies that the cell (or point) at the given index is selected on all processes. For multi-block datasets, we also need to indicate the block to which the cell or point belongs; while for AMR datasets, we need to specify the (AMR level, index) pair.
As shown in Figure [2], for Frustum selection, currently only the Show Frustum option is available. When this option is turned on, ParaView shows the selection frustum in the 3D view. In the future, we will implement a 3D widget to modify the frustum.
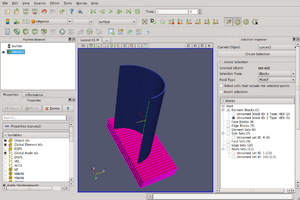
As shown in Figure [3], for Block selection, the full composite tree is shown in the inspector with the selected blocks checked. Using the selection inspector one can create a selection based on thresholds for scalars in the dataset. Choose the scalar array and then add value ranges for the selected cells (or points).
Selection inspector can be used to create location based selection. When field type is CELL, cells at the indicated 3D locations will be selected. When field type is POINT, the point closest to the location within a certain threshold is selected. If Select cells that include the selected points is checked, then all the cells that contain the selected point are selected. It is possible to specify more than one location. To aid in choosing positions, one can turn the Show location widgets option on. As a result ParaView will show cross hairs in the active 3D view which can be moved interactively, as shown in Figure [4].
Selection inspector also provides a means to create global id based selection. These are similar to index based selection however since global ids are unique across all processes and blocks, one does not need to specify any additional as needed by the id based selection.
Convert Selections
Selection inspector can also be used to convert a selection of one type to another. With some valid active selection present, if one changes the selection type then ParaView will try to convert the current selection to the new type, still preserving the cells (or points) that were selected, if possible. For example, if one create a frustum based selection and then changes the selection type to IDs, ParaView will determine the indices for all the cells (or points) that lie with the frustum and initialize the new index based selection with those indices. Note that the number of cells or points that get selected in frustum selection mode can potentially be very large; hence this conversion can be slow and memory expensive. Similarly, if the dataset provides global ids, then it is possible to convert between IDs selection and global id based selection.
It is not possible to convert between all types of selections due to obvious reasons. Conversions between id based and global id based selections, conversions from frustum to id based selections, and conversions from frustum to global id based selections are supported by the selection inspector.
Label Selected Cell/Points
Once an active selection is created, we can label the selected cells or points in a 3D view. This can be done using the selection inspector. At the bottom of the selection inspector panel, there are two tabs Cell Label and Point Label which can be used to change the cell or point label visibility and other label attributes such color, font etc. These tabs are enabled only if the active view is a 3D view. Any changes done in the Display Style group (including the labels) only affect the active 3D view.
Extract Selection
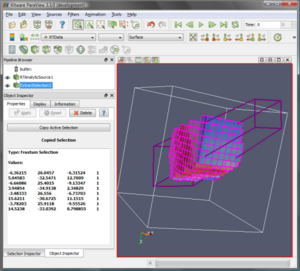
Selection makes it possible to highlight and observe regions of interest. Oftentimes once a region of interest has been identified, one would like to apply additional operations on it, such as apply filters to only the selected section of the data. This can be achieved using the Extract Selection filter. To set the selection to extract, create a selection using any of the methods already described. Then apply the extract selection filter to the source producing the selected data. To copy the active selection to the filter, use the Copy Active Selection button. One can change the active selection at any time and update the filter to use it by using this button. Figure [5] shows the extract selection filter applied after a frustum selection operation. Now, one can treat this as any other data source and apply filters to it, save state, save data etc.
Plot Selection over Time
For time varying datasets, you may want to analyze how the data variables change over time for a particular cell or a point. This can be done using the Plot Selection Over Time filter. This filter is similar to the Extract Selection filter, except that it extracts the selection for all time-steps provided by the data source (typically a reader) and accumulates the values for all the cell (or point) attributes over time. Since the selection can comprise of multiple cells or points, the display tab provides the Select Block widget which can be used to select the cell or point to plot, as shown in Figure [6]. Currently only one cell (or point) can be plotted at once in the same xy-plot view. One can create multiple plot views to show multiple plots simultaneously.
Conclusion
Although we touched on every aspect of the selection functionality in ParaView, we only scratched the surface of what can be achieved with this extremely powerful feature. The selection mechanism provides many ways of focusing on the important part of your dataset and, with the help of the spreadsheet view, a direct way to the raw data. With some experimentation, you will probably discover new ways of using it that we have not anticipated. That is the way of ParaView.


